Election charts
Live visualization
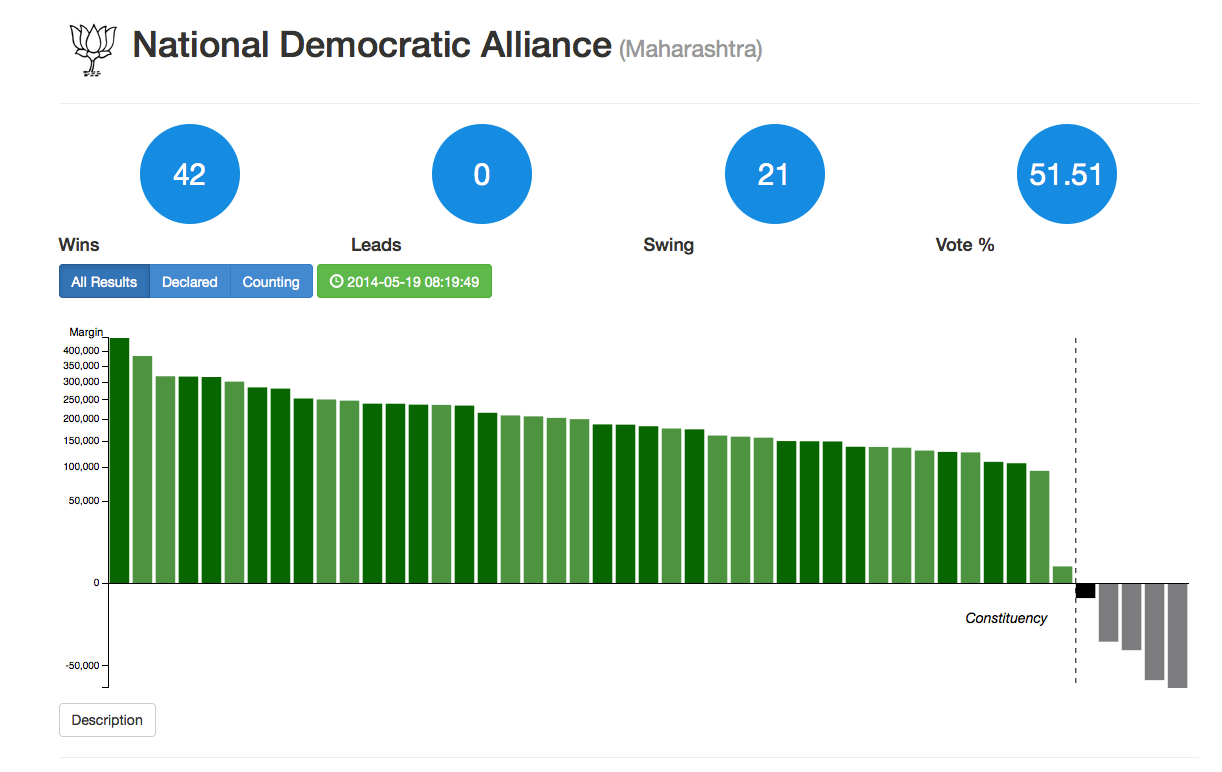
Motivation
This project was born out of a desire to visually see how closely fought an election is. The idea was to go beyond Wins/Losses (or Leads/Trails) when tracking the (live) results of a political party. This was implemented for the 2014 general elections in India.
Details
I brought together a group of 5 people (friends and ex-colleagues) before the 2014 elections in India to setup a web portal which would show live election results on the day of counting. There were four parts to the project:
- Scraping data for names of constituencies, candidates and past results
- A Scraper which scrapes the Election Commission results live on result day and pipes the data to the database
- A flask based web app
- A D3.js based visualization
The repository for the application is linked below and a live visualization with some real data can be found by clicking on the image to the left