EPL Twitter
Live Visualization
Leicester City Wins the English Premier League (Motivation)
I wanted to play with the Twitter streaming API and I thought that collecting tweets during the historic moment when Leicester wins the league would be interesting.
Details
I used the Twitter streaming API and polled Tweets based on certain hashtags and then saved and analyzed the Tweets using the following tools:
- A node.js app
- AWS Firehose Kinesis
- S3 bucket
- PySpark
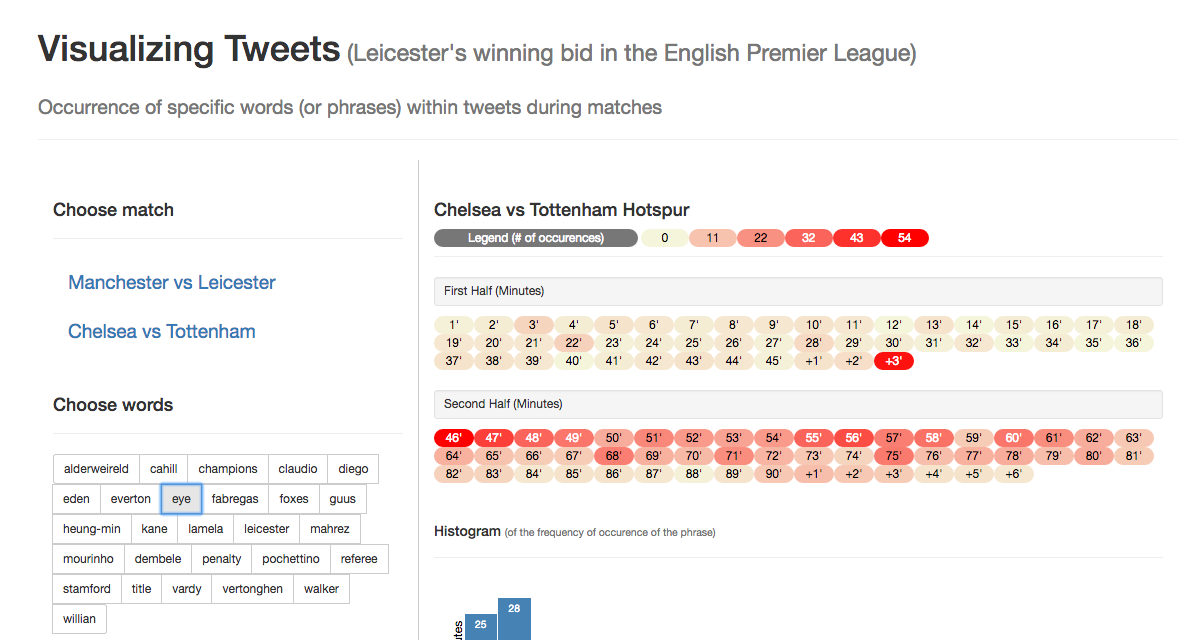
As the title contention stretched over two matches, I was able to record Twitter's reaction to both the Manchester United vs Leicester City match (May 1, 2016) and the Chelsea vs Tottenham Hotspur match (May 2, 2016). Further I actually collected tweets for about four hours after Leicester had won the league. This period should also throw up some interesting information.
For now I have made a visualization based on the occurrence of specific words over the course of these two matches. Clicking on the left image will lead to the visualization
Code
Possible Todos
- Adapt the visualization to look at occurrence of emotions in tweets during the match
- Do some sort of network analysis on the tweets
Possible Todos
- Adapt the visualization to look at occurrence of emotions in tweets during the match
- Do some sort of network analysis on the tweets